Catch The Dow and Elliott Waves
Dow Theory hasn’t missed a beat in over 100 years. So what does the mind of Charlie Dow have to offer modern traders? One of Dow’s powerful concepts is the three-waves principle. Decades after Dow first wrote on the subject, R.N. Elliott took up the cause to create his unique Elliot Wave Theory. So let’s combine their work, and see what these guys taught us a few dozen years before we discovered the markets were a good place to hang out.
Dow’s three waves were built on the concept of the primary trend. We all know what Charlie was talking about here. The primary trend is the major market direction over years or decades. This is how we determine whether we’re in a bull market or a bear market. Dow determined this primary trend by looking at long-term price patterns and seeing the obvious.
Elliott used his five-wave trend to reach the same conclusions. He noted that the primary trend was composed of three waves moving in the major direction and two waves moving against it. Furthermore, each primary wave hid a smaller wave structure that exposed the true nature of price direction. For example, Elliott commented that failures exhibited a rollover of certain waves within this fractal structure and gave rise to trend reversals.
In Dow’s world, a market printing higher highs and higher lows revealed a primary bull trend. Conversely, a market printing lower highs and lower lows revealed a primary bear trend. Elliott had no problem with this view, but he added a few twists of his own. For example, he pointed out how certain phases of a primary trend showed very limited counter-waves and rarely pulled back until the entire wave set was completed.
Three-wave principles get more interesting when Dow and Elliott describe characteristic crowd behavior in each of the waves. Let’s examine these through a bull market cycle.
The first wave triggers value buying by patient investors who anticipate better economic conditions and long-term growth. This occurs during the same period that sentiment records its lowest readings and experts tell everyone in sight to stay away from the financial markets. Value investors wake up from this gloom and realize that the fear-filled talk hides a nascent recovery. They buy aggressively from distressed sellers and nurture a sustainable bottom.
Elliott noted that this first wave shows very gradual price improvement and turns back on itself frequently to test lower levels. He also points out that this wave takes a long time to complete and gives a true bottoming appearance to the chart. The good news is that the market eventually triggers enough momentum to carry price up to much higher levels.
Bullish evidence begins to mount in Dow’s second wave. Improved corporate earnings, increased employment and unexpected innovation characterize this midpoint of a broad bull move. Less demanding investors now enter the market because they see better times ahead and want to participate. They build good-sized portfolios and start to follow the markets with great interest.
Elliott sees this wave as the most dependable phase of the entire bull cycle. Price movement advances rapidly, with less overlap from day to day. Small gaps appear between bars as investors buy high and look to sell higher. A sharp advance often triggers right in the middle of the wave, when a burst of enthusiasm forces a wide continuation gap. This powerful move often marks the exact middle for the entire three-wave event.
Danger signs grow during Dow’s third wave, but they’re hard to accept because of an outstanding market environment. Record earnings and full employment lead the media to proclaim an era in which the sky’s the limit. Joe Sixpack now joins the hunt as the public forgets about its losses from the last bear cycle. This broad market participation starts a buying panic. At this very moment, the smart-money investors who bought at the bottom begin to unload their positions into the hands of the waiting public. The market eventually runs out of gas and prints a long-term top.
The last wave in Elliott’s world can show a parabolic spike, or a failure move before it gets under way. This dichotomy points out the danger the public faces when it enters the stock market in force. Elliott noted that the large-scale reversal off this last wave may be very deep and painful. As we now know from personal experience, this rapid selloff addresses the many sins common to all bull cycles.
It’s easy to get into the market, but what about getting out? Most traders don’t have an exit plan, whether their positions are turning a profit or going down in flames. The truth is that a good exit will save your neck on a bad entry, and keep you in the game longer than good stock-picking.
Exit planning must deal with the good, the bad and the ugly. In other words, keep a profit protection strategy to exit winning trades, a stop loss strategy to get out of bad ones and a fire drill in case disaster strikes. You’ll need all three tactics in every trade, because anything can happen once you hit the order button.
Your holding period guides the profit side of the exit equation. Always seek the reward target that matches your time in the market. In other words, trade the most profitable move from your entry to the target within the time frame that you’re long or short the stock. This lets you apply both a time- and a price-based exit strategy to your winners.
A time-based exit strategy requires little interpretation. Focus on your holding period’s time window rather than the price action. Exit the trade immediately when price hits the reward target at the right time. Exit the trade before price hits the reward target if the window starts to close. The trick with time-based strategies is to look for the best price available within the chosen window.
Most traders should start with a price-based exit strategy. For example, you enter a long position, and it moves into a profit. It rallies at a moderate pace and hits your reward target within the holding period. You exit the trade “blind” at the reward price. This means you take the money and go, without considering the current price action.
You’ve just taken a nice profit in a perfect world, but how do you protect yourself in the real one? Start by focusing on trends within shorter-term time frames. For example, when trading a daily chart, manage profit and loss using a 60-minute chart whenever possible. The shorter-term pattern will tell you when to move the stop in order to protect profits, or when to exit the trade entirely.
Let’s outline common stages for a long position that eventually reaches the reward target:
- Price moves into a profit.
- Price reaches first resistance, and reverses.
- Price finds support and rallies through first resistance.
This action/reaction continues until price reaches the target. In this scenario, trade management requires a breakeven stop as soon as price moves into a profit. This stop should be moved up after the first reversal, but stay below short-term support. When price finally rallies above first resistance, move the stop just below this new level. Continue the process until the position hits the reward target.
Profits are nice, but many trades go haywire right away. The exit strategy is very simple in this situation: get out as soon as price breaks support on a long trade, or resistance on a short sale. This may sound simple, but there are two problems. First, many of us lack the discipline to take losses when they should be taken. Second, many of us don’t understand how to place stop losses in the first place.
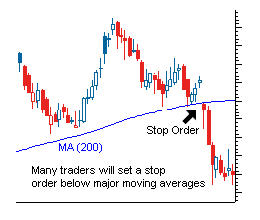
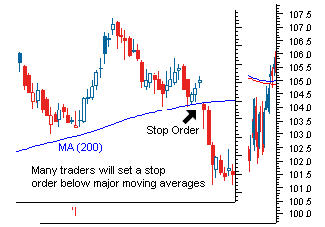
Take your loss when the market says you’re wrong. Every setup has a trigger that violates the pattern you intend to trade. Identify this price in advance, and place your stop just behind it. Remember that this magic number changes dynamically with each new bar, so you need to adjust it often. But don’t remove it under any circumstances.
Do you get frustrated because your stops get hit frequently on good trades? The fault lies in your analysis and trade management, not in the stops themselves. Many traders believe they can improve their performance by placing stops where they shouldn’t go. Every stock will violate support/resistance up to a point before reversing. Your analysis must consider the stock’s underlying volatility, so the stop can be placed outside this “market noise.”
 Finally, you need a way to deal with unexpected bad news. Start with a panic drill, and practice it over and over again in your head. The exit strategy is simple: If you can beat the rest of the crowd out of the door, act immediately. The after-hours market can save you a fortune if you learn to use it wisely. If you can’t escape right away, watch price action closely and take your best shot. The market can do anything it wants once bad news hits, and you may need to accept a large loss.
Sudden losses are a cost of doing business as a trader. Full disclosure rules and external events will impact your bottom line from time to time. Reduce your risk by choosing lower-volatility stocks to carry over longer time periods. Avoid holding anything through earnings reports or terrorist threats. Remember, it’s not hard to rebuild profits after the unexpected takes a bite out of your bottom line.
Many folks believe good chart-reading automatically leads to profitable trading. Unfortunately, this isn’t true. While technical analysis and trading are interrelated skills, chart-reading requires no capital or emotional commitment. In contrast, real-life trading places both of these elements at risk in an unforgiving environment.
I publish hundreds of trade setups each month. But none of these ideas will put money in your pocket without good timing. It’s a critical error to enter a trade just because it has a pretty chart. The opportunity comes only when you can discover and capitalize on the setup’s timing signals.
Careful entry bridges the gap between the setup and the trade. This is the door through which you take on monetary and emotional risk. There are many ways to time the market, but three strategies work for most swing trades. First, enter a breakout or breakdown after it’s under way. Second, wait for a pullback and enter near support/resistance. Third, buy or sell within a narrow range before the move begins.
Which is the best entry strategy for your next trade? Unfortunately, the right answer is never the same twice. Don’t try to render entry rules into simple repetitive tasks. In truth, you need to plan each trade within the context of the current market environment, reward-to-risk ratio and chosen holding period. This extra effort is a necessity, not a luxury.
Let’s examine these three entry strategies. Over time you’ll learn how to pick the best one for the trade you’re ready to make. Keep in mind that several different strategies might work with the same setup. The right choice could have more to do with intestinal fortitude than market timing.
Buying a breakout or selling a breakdown is the only timing method employed by most traders. Unfortunately, it’s also the best way to wash out of the markets. This entry technique is simple. Your setup breaks through support or resistance, so you rush in to place a position. And then you pray.
This is a very risky way to enter the market. The trade looks great when it moves in your direction, but what do you do if it reverses and takes off the other way? Amazingly, most folks don’t have a good answer to this important question. So they freeze like a deer in the headlights when faced with the reality.
Chasing momentum can work if traders choose their plays wisely and pay close attention to two important rules. First, always establish your risk before making the trade. Choose a flat stop-loss percentage, or use a pattern in a lower time frame to signal when the trade goes against you. Second, make sure the broader market offers adequate support for your strategy. Momentum stocks benefit from momentum markets.
What’s your rush? Many traders believe they’re too late when they stumble across a breakout in progress. In fact, they’re often too early. Many times you’re better off standing aside and waiting for the market to reverse, rather than jumping in with the crowd. Pullback entry is a very powerful method because it uses the eager capital of those who missed the first move. But the trick is to get into the trade before they do, and let their enthusiasm carry you into a profit.
Pullback entry is very price-sensitive. If possible, place a limit order where you expect the pullback to shift toward the breakout direction. This is actually easier than it sounds. New trends frequently return to prior support/resistance before momentum finally kicks in. So look at the chart and find where the initial breakout took place. Pullbacks often move to these important levels like magnets.
 Narrow range entry confuses many traders, but the theory is simple. Common sense dictates the best time to enter a new position is just before a breakout or breakdown. Narrow range uses characteristics of low volatility to identify when conditions are ripe for a big move. The trader enters at a tight price level and waits for a move to begin. The advantage is that the position can be exited for a small loss if the market breaks the other way.
Congestion patterns, such as triangles, often look like coiled springs. Paradoxically, this wound-up appearance predicts the return of rapid price movement. Traders can use classic indicators, such as historical volatility, to identify trigger points for this movement. But a better way is to locate narrow range bars and declining volume right at key support/resistance levels. Enter the trade here while everyone else gets ready to chase the breakout or breakdown.
It’s easy to chase your tail before making a new trade. In fact, most of us don’t know what to look for before we commit our capital. Simply stated, each opportunity should speak for itself. The best way to decide whether a given trade does that is to first answer a few basic questions:
- What is the trend or range intensity?
- What is the direction of the next price move?
- When will this move occur?
Concentrate on the three Cs to find the answers you need to make the trade. Recognize trend-range intensity through time-frame convergence. Predict price direction through the will of the crowd. And align market timing through range contraction.
Markets alternate between up-down trends and sideways ranges. This is true in all time frames. Price movement swings through synergy and conflict as trends collide or converge. The strongest trends emerge when multiple time frames stack up into directional movement. The most persistent ranges appear when multilayered conflict stalls price change.
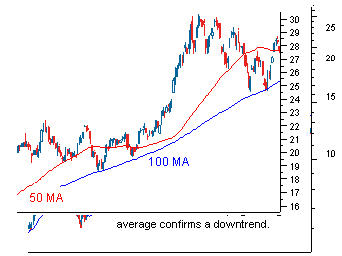
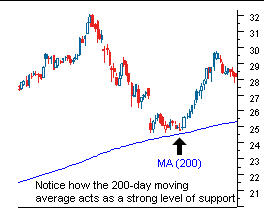
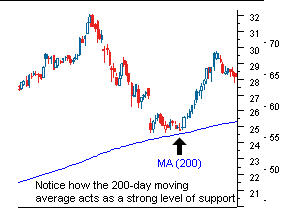
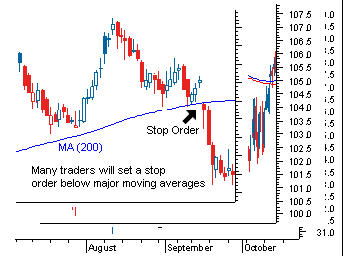
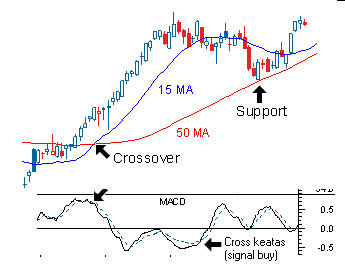
Use moving average ribbons (MARs) to study trend intensity. These handy tools illustrate complex relationships through simple interactions. Start by finding where current price sits in the ribbons. Since price always moves toward or away from underlying averages, each new bar reveals characteristics of momentum, trend and time. Tie MARs together in a logical way. For example, use 20-, 50- and 200-day averages to view distinct short, intermediate and long-term trends.
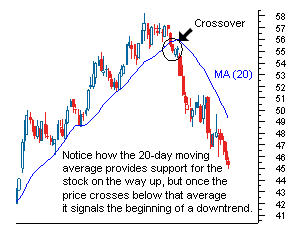
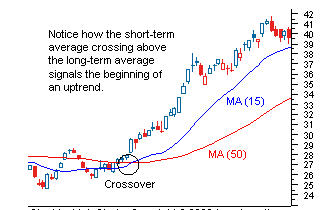
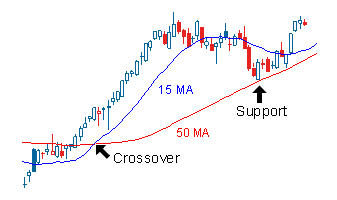
The interplay between averages exposes market phases and trend acceleration. Look for a bear market when MARs flip over and the 200-day MA sits on top. Look for the bull to return when it crosses back and each MA lines up, from shortest to longest. Expect choppy action when averages criss-cross out of sequence. Price, for example, can bounce like a pinball when it gets caught between inverted averages.
Volume defines the crowd. Studying market volume has two primary functions. First, it gauges the strength of ownership and the passion of the owners. Second, it filters the crowd’s divergent impulses and predicts their herd behavior. Capture this vital information with a simple volume histogram (preferably color-coded) and an accumulation indicator such as on-balance volume (OBV). Volume is deceptively simple. The lack of a clear relationship between price and volume undermines accurate prediction. Volume leads the crowd as often as it lags, but always makes perfect sense in hindsight. Examine price action closely before timing trades to a volume pattern. And move quickly to other opportunities when the crowd gives mixed signals.
 Range-bound markets lower volatility and dissipate crowd excitement. Eventually congestion reaches a balance point where a new trend can begin. This cooling-off phase sounds simple, but it’s very hard to trade profitably. Declining volatility fosters crowd disinterest, profit taking and indecision. The chart draws a series of narrowing range bars (the distance from bar high to low). Then a new trend explodes just when everyone turns their backs, but most miss the trade because it gathers no crowd until it passes.
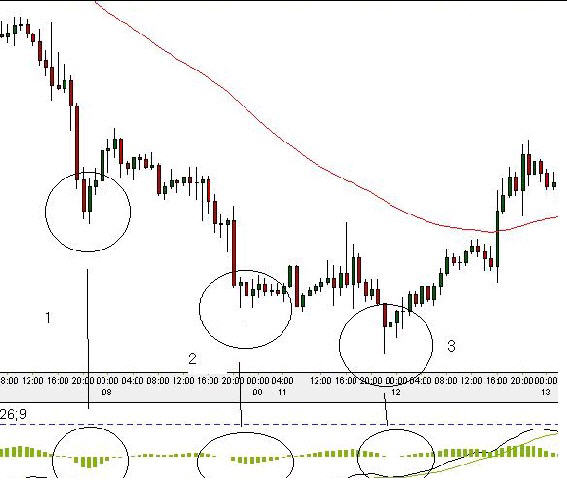
Find the narrowest range bar of the last seven bars (NR7) to locate this sudden congestion breakout. Its predictive power lies in the location where it appears. NR7s work best right in the middle of congestion, or when price pushes repeatedly against a major barrier. When the signal works, it works fast and triggers a major price expansion without a pullback.
How do you trade an NR7? Place an entry stop just outside both price extremes at the same time, and then cancel one order after the other executes. Then place a stop loss at the location of the cancelled order. This takes advantage of the small pattern, regardless of the way it eventually breaks out.
You can answer the three questions with a single price chart and a few good indicators. This way you’ll know what to do next with very little effort. Get on board quickly when everything converges and points to an impending move. Multiple signals reveal crowd forces that converge into intense breakouts or breakdowns. These focused time-price zones line up with the right answers at the right time.
Sumber www.tradingday.com


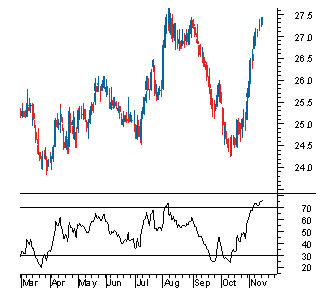
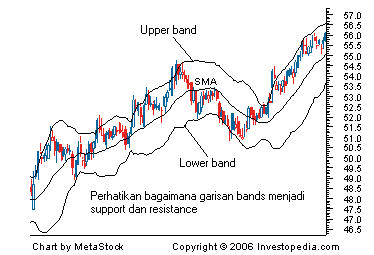 Secara amnya, pergerakan harga pasaran yang berada dekat dengan upperband boleh dikatakan “overbought” dan bila berada hampir dengan lowerband boleh dikatan sebagai “oversold”.
 Seperti indicator indicator